
Every Monday morning, manufacturing leaders face the same frustration. You sit down for the weekly production meeting with a stack of reports that tell you exactly what went wrong last Tuesday. By the time you see the data, the opportunity to fix the issue has passed. You are managing through a rearview mirror.
Overall Equipment Effectiveness (OEE) is the gold standard for measuring shop floor productivity, but most companies treat OEE benchmarks as a static goal to reach rather than a live tool to use. If your OEE data lives in a spreadsheet that someone updates once a week, you are not actually managing your plant. You are just documenting its decline.
To move the needle on profitability, you need to move away from industry averages and toward real time visibility. This post explores how to set OEE benchmarks that matter and why a live manufacturing dashboard is the only way to make those numbers mean something for your bottom line.
The Myth of the World Class OEE Benchmark
If you search for OEE benchmarks online, you will quickly find the number 85 percent. This is often cited as world class performance. It sounds like a great target, but for most mid sized manufacturers, chasing a generic 85 percent goal is a distraction.
Benchmarks are only useful if they are relevant to your specific equipment, your team, and your product mix. A plant running high volume, low complexity parts might find 85 percent easy to achieve. A specialised shop doing complex, low volume runs might be highly profitable at 60 percent.
The benchmark that actually moves the needle is not an industry average. It is your own best day, repeated consistently. When you stop comparing yourself to a theoretical global standard and start comparing your Tuesday morning shift to your Wednesday afternoon shift, you find the real waste.
The question worth answering is not whether the plant has reached 85 percent. It is why Machine 4 is running 12 percent below Machine 2 today. For an IT Manager or a COO, that level of insight is worth more than any industry report.
Breaking Down the Big Three: Availability, Performance, and Quality
OEE is calculated by multiplying three factors: Availability, Performance, and Quality. To improve the final number, you have to understand which of these shop floor KPIs is dragging you down.
Availability: This measures uptime. If the machine is scheduled to run for eight hours but sits idle for two hours due to a breakdown or a slow changeover, your availability is 75 percent.
Performance: This measures speed. If the machine is running but only producing at 80 percent of its ideal cycle time, you are losing money on every second of operation.
Quality: This measures good units versus scrap. If you produce 1,000 parts but 50 are defective, your quality rate is 95 percent.
A live OEE tracking system shows you these three numbers in real time. Without live data, you might see a dip in OEE and assume you have a maintenance problem (Availability). In reality, your operators might be slowing the machines down to avoid a known quality issue (Performance).
When you see these numbers update every minute on a manufacturing dashboard, you can spot the nuance. You can see that the performance drop started exactly when a new batch of raw material was loaded. That is an insight you can act on immediately, not five days later.
Why Lagging Data Kills Shop Floor Profitability
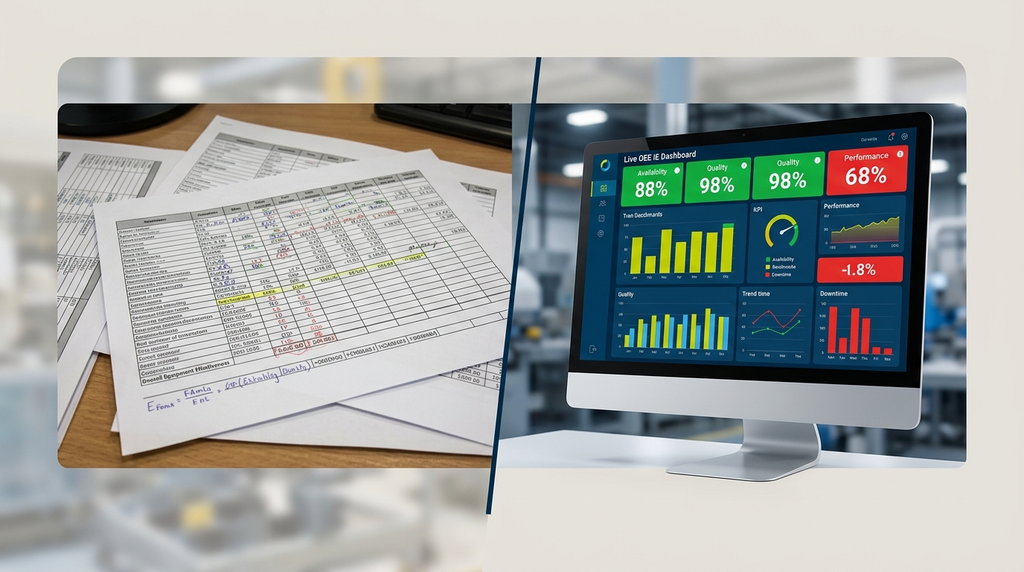
Most manufacturing organisations suffer from a data delay. The process usually looks like this: operators write down downtime on paper logs, a supervisor collects those logs at the end of the shift, and an admin enters them into a spreadsheet on Friday. The IT Manager then spends Monday morning trying to make the charts look presentable for the COO.
This lag is expensive. If a machine has a micro stop every ten minutes, it might not seem like a big deal to the operator. Over a week, those micro stops add up to hours of lost production. In a lagging data environment, you do not see the cumulative effect of those stops until the end of the month.
By then, you have already lost the revenue. You have paid for the labour, the power, and the overhead, but you have fewer units to sell.
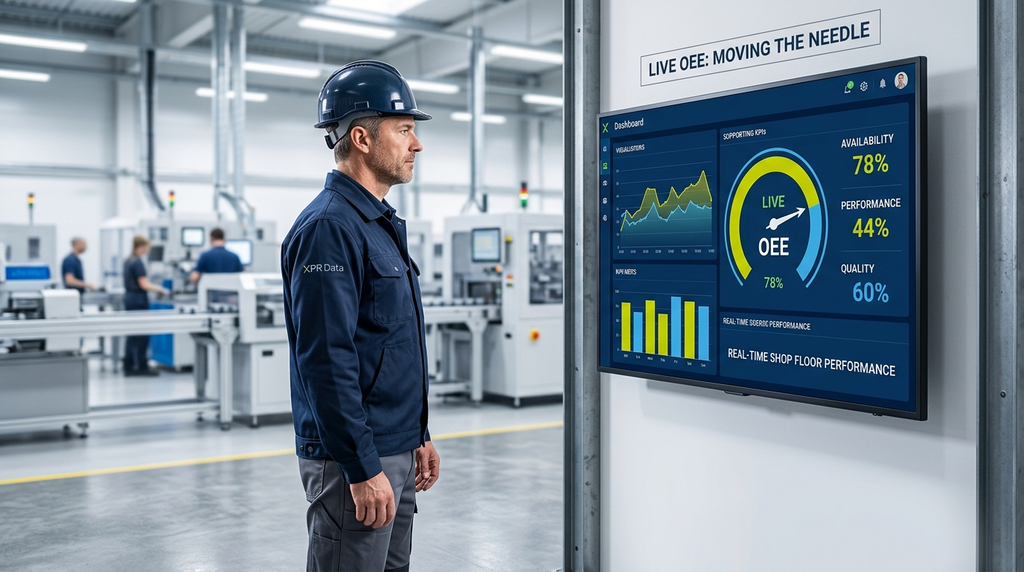
A live dashboard changes the conversation. It turns OEE from a historical record into a diagnostic tool. Instead of asking “What happened last week?” the COO can ask “Why is Line 3 trending downward right now?” This shift from reactive to proactive management is where the profit is found.
What a Live Dashboard Changes for the IT Manager
For an IT Manager, the biggest fear of any new software is the build burden. Traditional Business Intelligence (BI) projects often take six to twelve months to stand up. They require complex data engineering, expensive consultants, and constant maintenance.
XPR Data approaches this differently. We believe a manufacturing dashboard should be fast to deploy and affordable to maintain. We unify your existing shop floor data, whether it comes from PLC sensors, ERP systems, or manual inputs, into one source of truth.
Because our platform is an integration layer rather than a closed box, it does not become a permanent project for your IT team. We stand up live dashboards in days, not months. This means you can show value to the board before the next quarterly meeting.
There is no usage-based pricing surprise, and no bill that grows as more people use it. For a flat annual fee, you get a system that updates itself. You stop being the person who has to fix the broken Excel macros and start being the person who provided the company with its most valuable decision-making tool.
The COO Perspective: Managing Margins in Real Time
As a COO, your job is to protect the margin. In the current economic climate, with rising material costs and labour shortages, you cannot afford to be inefficient.
OEE benchmarks give you a way to hold the shop floor accountable, but only if the data is trusted. When data is manual, operators and supervisors often argue about the accuracy of the numbers. A live dashboard removes the emotion from the room. The data is the data.
When you can see your OEE trend by Friday afternoon, you can make adjustments for the following week. You can decide to move a high priority order to a more reliable machine or schedule emergency maintenance before a total failure occurs.
This visibility directly impacts the safety pyramid as well. Often, a drop in OEE performance precedes an increase in safety incidents as operators try to “make up time” by cutting corners. By monitoring the OEE benchmarks in real time, you can intervene before the pressure leads to an accident.

Fast, Affordable, and Profitable: The XPR Data Fit
We built XPR Data for companies that are tired of the “enterprise” way of doing things. You do not need a £300,000 software suite to see your OEE. You need a system that works with what you already have.
Fast: We connect to your systems and deliver your first dashboards in a matter of days. You don’t have to wait for a long implementation cycle to see your shop floor KPIs. Our Quick Start process is designed to get you there with minimal disruption.
Affordable: Our flat fee model means you know exactly what your spend is. There are no hidden costs for adding more users or more data.
Profitable: By identifying just a 2 percent improvement in OEE through live tracking, most manufacturers see the system pay for itself in the first few months.
Our platform also ensures you are not locked into a single AI or data vendor. As the “brain” of your data operation, XPR Data allows you to swap out models or tools in the future without rebuilding your entire dashboard infrastructure. Your data remains your data.
Frequently Asked Questions
What is a good OEE benchmark for a mid sized manufacturer?
While 85 percent is often called world class, a good benchmark is actually 5 to 10 percent above your current rolling average. Focus on incremental gains rather than hitting a generic industry number.
How long does it take to set up a live OEE dashboard?
With XPR Data, we typically move from data connection to a live, functional dashboard in days. We focus on the most impactful KPIs first so you get value immediately. You can see how our Quick Start works here.
Do we need to install new sensors on all our machines?
Not necessarily. Many modern machines already have the data available in their controllers. For older equipment, we can often pull data from existing production logs or simple, affordable IoT add ons. If you are unsure what your machines already produce, talk to our team and we will help you work it out.
Why is a live dashboard better than an ERP report?
ERP reports are usually financial and lagging. They tell you what was invoiced. A live dashboard tells you what is happening on the floor right now, allowing you to fix problems before they hit your financial reports.
Conclusion: Start Managing Your Monday Before It Happens
Chasing OEE benchmarks should not be a mathematical exercise you perform once a month. It should be the way you run your business every single day. When you move to live OEE tracking, you stop guessing and start knowing.
You can see the scrap rate before it ruins your margin. You can see the downtime before it delays a shipment. You can see the performance gap before it becomes a crisis.
If you are ready to stop reconciling five different spreadsheets and start seeing your shop floor in real time, XPR Data is here to help. We provide the clarity you need to make smarter decisions, faster.
Ready to see your shop floor data in a new light? Contact XPR Data to see how we can turn your manufacturing data into a live dashboard in days, not months. If you would prefer to see the approach first, start with our solution overview or answer a few Quick Start questions.